

Process and Visual iterations
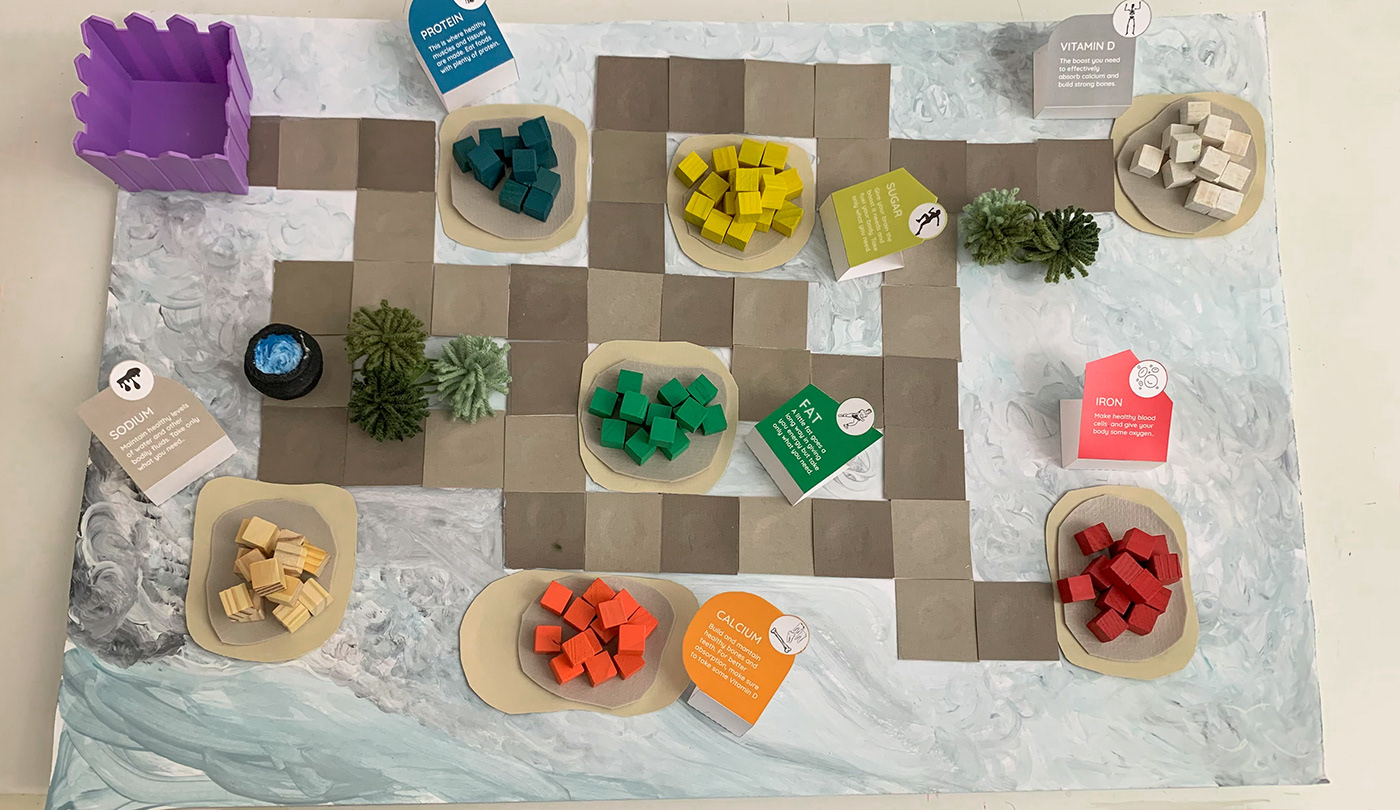
Our process explored different ways of representing nutritional data to educate consumers. While collecting data from nutrition labels, we took note of some of the challenges of interpreting them and used this to inform our design of the interaction. We used color to differentiate nutrients from each other; this was incorporated into the nutrient label and physical nutrient tokens. Twenty tokens, worth 5% of daily values, were created for each nutrient corresponding to 100% of total daily values.

Data
To conduct our research, we visited Toronto's largest department stores. Using the nutrition labels on their packaging, we were able to analyze the nutritional compositions of the milk and plant based beverages we uncovered. We chose to collect data from Loblaws and Walmart as they are two of the largest Canadian retailers, including corporate and franchise supermarkets.

Final Output (Data Physicalization)
Consumers are invited to shop for their nutrients through making assumptions about the amounts they require from a cup of milk. Once done, they compare the contents of their shopping to the labels on the milk cartons which correspond in color to the nutrient tokens. This helps the consumer identify key insights for themselves, enabling them to make more informed decisions about the right milk.

Placement of Data Visualization in Real World:
We envision this visualization to be placed as an instore display in a supermarket to engage with consumers already making decisions around which products to purchase.

Thank-you!

